Tracking ML Experiments with Neptune.ai
Switching from spreadsheets to Neptune to improve model building


- 1. Introduction
- 2. What is wrong with spreadsheets for experiment tracking?
- 3. Switching from spreadsheets to Neptune
- 4. What is good about Neptune?
- 4. Tips to improve Kaggle performance with Neptune
- 5. Final thoughts
This blog post is also published on the Neptune.ai blog.
1. Introduction
Many ML projects, including Kaggle competitions, have a similar workflow. You start with a simple pipeline with a benchmark model. Next, you begin incorporating improvements: adding features, augmenting the data, tuning the model... On each iteration, you evaluate your solution and keep changes that improve the target metric.
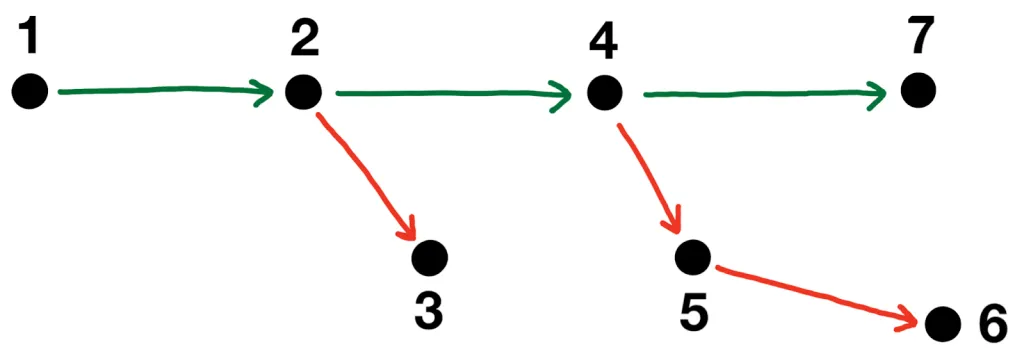
The figure illustrates the iterative improvement process in ML projects.
This workflow involves running a lot of experiments. As time goes by, it becomes difficult to keep track of the progress and positive changes. Instead of working on new ideas, you spend time thinking:
- “have I already tried this thing?”,
- “what was that hyperparameter value that worked so well last week?”
You end up running the same stuff multiple times. If you are not tracking your experiments yet, I highly recommend you to start! In my previous Kaggle projects, I used to rely on spreadsheets for tracking. It worked very well in the beginning, but soon I realized that setting up and managing spreadsheets with experiment meta-data requires loads of additional work. I got tired of manually filling in model parameters and performance values after each experiment and really wanted to switch to an automated solution.
This is when I discovered Neptune.ai. This tool allowed me to save a lot of time and focus on modeling decisions, which helped me to earn three medals in Kaggle competitions.
In this post, I will share my story of switching from spreadsheets to Neptune for experiment tracking. I will describe a few disadvantages of spreadsheets, explain how Neptune helps to address them, and give a couple of tips on using Neptune for Kaggle.
2. What is wrong with spreadsheets for experiment tracking?
Spreadsheets are great for many purposes. To track experiments, you can simply set up a spreadsheet with different columns containing the relevant parameters and performance of your pipeline. It is also easy to share this spreadsheet with teammates.
Sounds great, right?
Unfortunately, there are a few problems with this.
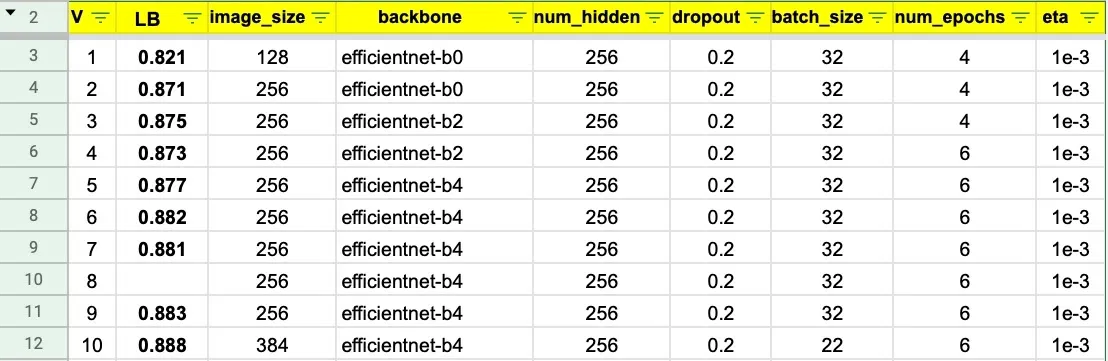
The figure illustrates ML experiment tracking with spreadsheets.
Manual work
After doing it for a while, you will notice that maintaining a spreadsheet starts eating too much time. You need to manually fill in a row with meta-data for each new experiment and add a column for each new parameter. This will get out of control once your pipeline becomes more sophisticated.
It is also very easy to make a typo, which can lead to bad decisions.
When working on one deep learning competition, I incorrectly entered a learning rate in one of my experiments. Looking at the spreadsheet, I concluded that a high learning rate decreases the accuracy and went on working on other things. It was only a few days later when I realized that there was a typo and poor performance actually comes from a low learning rate. This cost me two days of work invested in the wrong direction based on a false conclusion.
No live tracking
With spreadsheets, you need to wait until an experiment is completed in order to record the performance.
Apart from being frustrated to do it manually every time, this also does not allow you to compare intermediate results across the experiments, which is helpful to see if a new run looks promising.
Of course, you can log in model performance after every epoch, but doing it manually for each experiment requires even more time and effort. I never had enough diligence to do it regularly and ended up spending some computing resources not optimally.
Attachment limitations
Another issue with spreadsheets is that they only support textual meta-data that can be entered in a cell.
What if you want to attach other meta-data like:
- model weights,
- source code,
- plots with model predictions,
- input data version?
You need to manually store this stuff in your project folders outside of the spreadsheet.
In practice, it gets complicated to organize and sync experiment outputs between local machines, Google Colab, Kaggle Notebooks, and other environments your teammates might use. Having such meta-data attached to a tracking spreadsheet seems useful, but it is very difficult to do it.
3. Switching from spreadsheets to Neptune
A few months ago, our team was working on a Cassava Leaf Disease competition and used Google spreadsheets for experiment tracking. One month into the challenge, our spreadsheet was already cluttered:
- Some runs were missing performance because one of us forgot to log it in and did not have the results anymore.
- PDFs with loss curves were scattered over Google Drive and Kaggle Notebooks.
- Some parameters might have been entered incorrectly, but it was too time-consuming to restore and double-check older script versions.
It was difficult to make good data-driven decisions based on our spreadsheet.
Even though there were only four weeks left, we decided to switch to Neptune. I was surprised to see how little effort it actually took us to set it up. In brief, there are three main steps:
- sign up for a Neptune account and create a project,
- install the neptune package in your environment,
- include several lines in the pipeline to enable logging of relevant meta-data.
You can read more about the exact steps to start using Neptune here. Of course, going through the documentation and getting familiar with the platform may take you a few hours. But remember that this is only a one-time investment. After learning the tool once, I was able to automate much of the tracking and rely on Neptune in the next Kaggle competitions with very little extra effort
import neptune.new as neptune

run = neptune.init(project = '#', api_token = '#') # your credentials

# Track relevant parameters
config = {
    'batch_size': 64,
    'learning_rate': 0.001,
    'optimizer': 'Adam'
    }
run['parameters'] =  config

# Track the training process by logging your training metrics
for epoch in range(100):
    run['train/accuracy'].log(epoch * 0.6)

# Log the final results
run['f1_score'] = 0.66
You don’t have to manually put it in the results table, and you also save yourself from making a typo. Since the meta-data is sent to Neptune directly from the code, you will get all numbers right no matter how many digits they have.
It may sound like a small thing, but the time saved from logging in each experiment accumulates very quickly and leads to tangible gains by the end of the project. This gives you an opportunity to not think too much about the actual tracking process and better focus on the modeling decisions. In a way, this is like hiring an assistant to take care of some boring (but very useful) logging tasks so that you can focus more on the creative work.
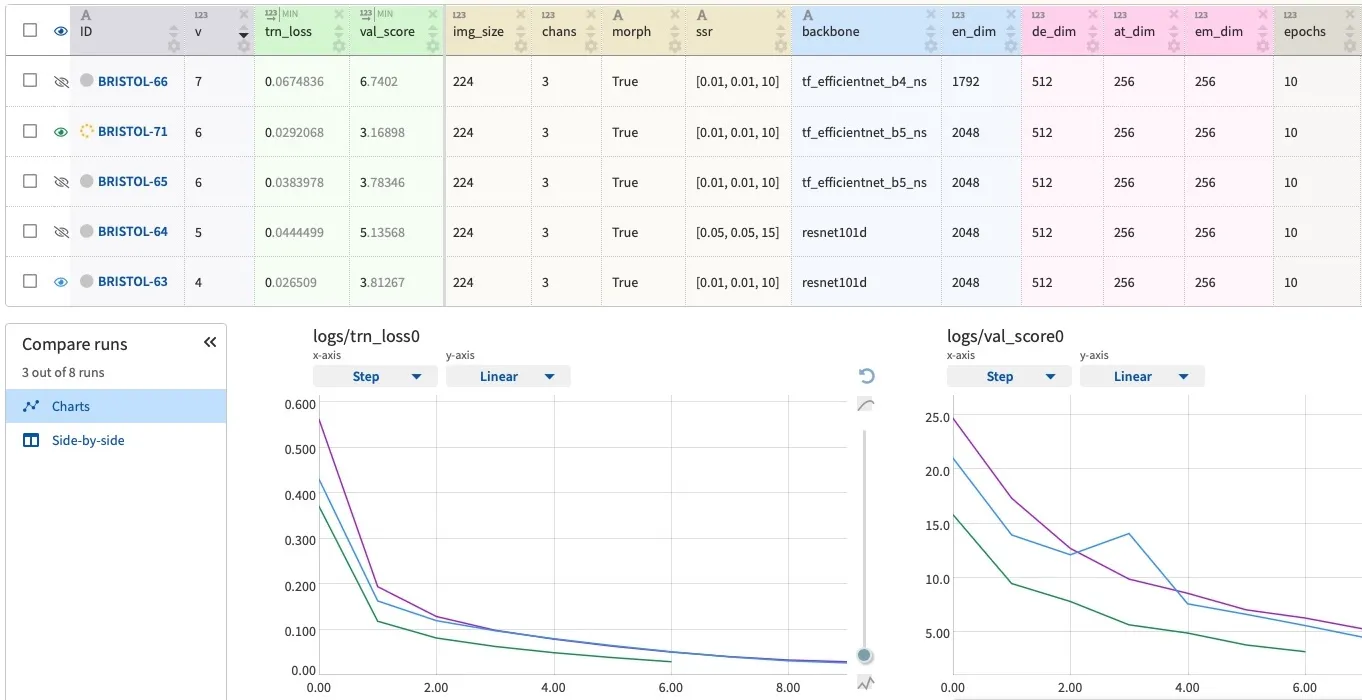
Live tracking
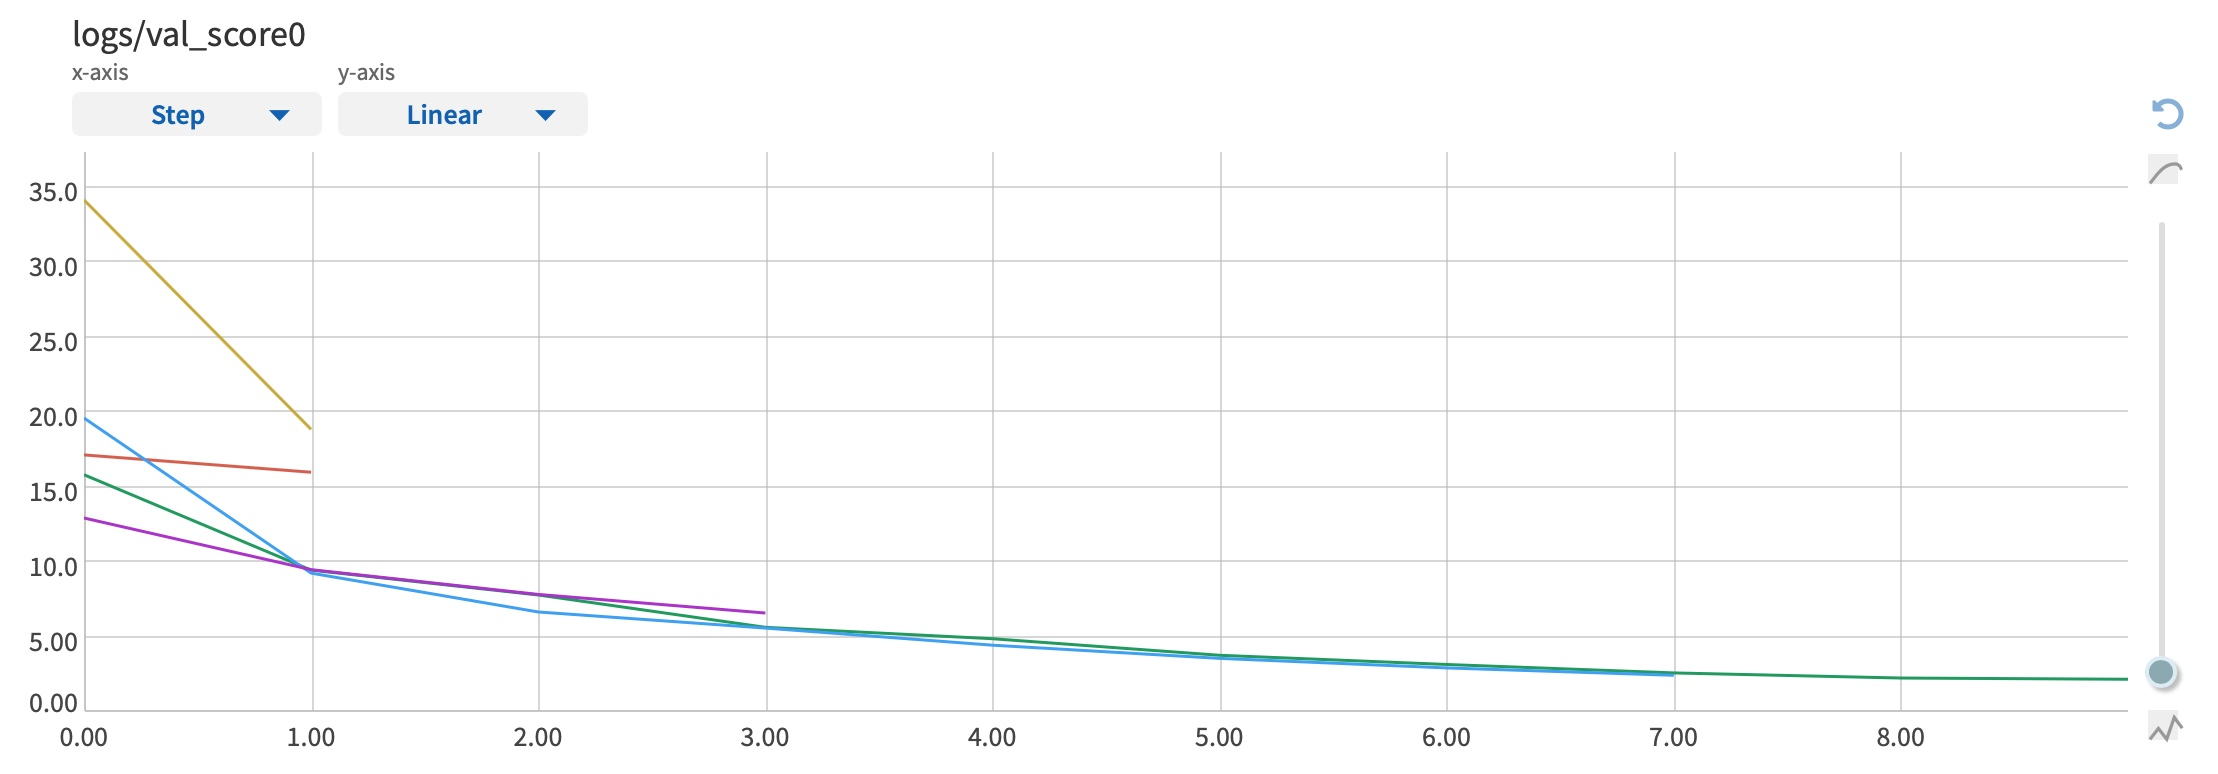
What I like a lot about Neptune is that it allows you to do live tracking. If you work with models like neural networks or gradient boosting that require a lot of iterations before convergence, you know it is quite useful to look at the loss dynamics early to detect issues and compare models.
Tracking intermediate results in a spreadsheet is too frustrating. Neptune API can log in performance after every epoch or even every batch so that you can start comparing the learning curves while your experiment is still running.
This proves to be very helpful. As you might expect, many ML experiments have negative results (sorry, but this great idea you were working on for a few days actually decreases the accuracy).
This is completely fine because this is how ML works.
What is not fine is that you may need to wait a long time until getting that negative signal from your pipeline. Using Neptune dashboard to compare the intermediate plots with the first few performance values may be enough to realize that you need to stop the experiment and change something.
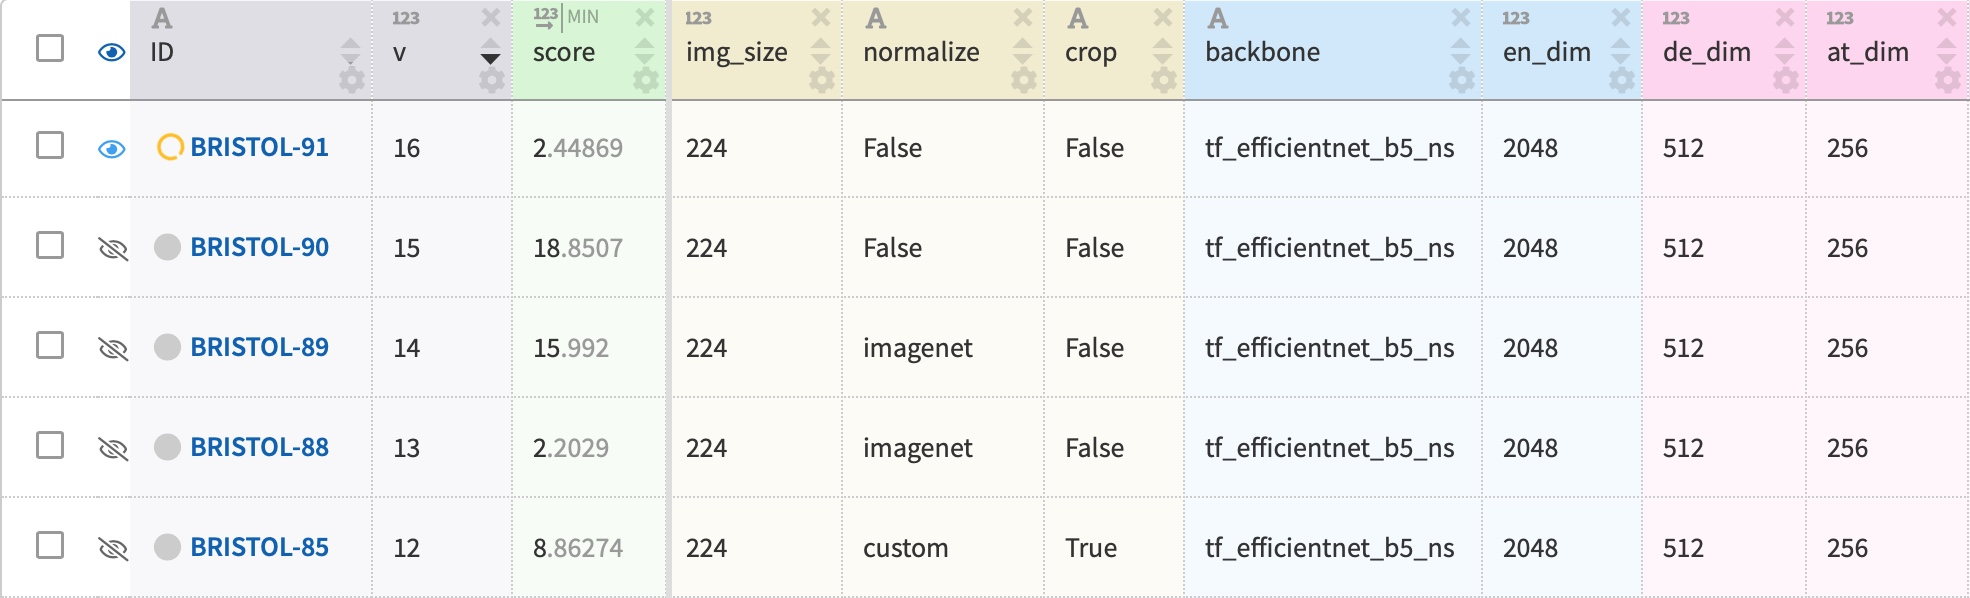
Attaching outputs
Another advantage of Neptune is the ability to attach pretty much anything to every experiment run. This really helps to keep important outputs such as model weights and predictions in one place and easily access them from your experiments table.
This is particularly helpful if you and your colleagues work in different environments and have to manually upload the outputs to sync the files.
I also like the ability to attach the source code to each run to make sure you have the notebook version that produced the corresponding result. This can be very useful in case you want to revert some changes that did not improve the performance and would like to go back to the previous best version.
Using Neptune in Kaggle Notebooks or Google Colab
First, Neptune is very helpful for working in Kaggle Notebooks or Google Colab that have session time limits when using GPU/TPU. I can not count how many times I lost all experiment outputs due to a notebook crash when training was taking just a few minutes more than the allowed 9-hour limit!
To avoid that, I would highly recommend setting up Neptune such that model weights and loss metrics are stored after each epoch. That way, you will always have a checkpoint uploaded to Neptune servers to resume your training even if your Kaggle notebook times out. You will also have an opportunity to compare your intermediate results before the session crash with other experiments to judge their potential.
Updating runs with the Kaggle leaderboard score
Second, an important metric to track in Kaggle projects is the leaderboard score. With Neptune, you can track your cross-validation score automatically but getting the leaderboard score inside the code is not possible since it requires you to submit predictions via the Kaggle website.
The most convenient way to add the leaderboard score of your experiment to the Neptune tracking table is to use the "resume run" functionality. It allows you to update any finished experiment with a new metric with a couple of lines of code. This feature is also helpful to resume tracking crashed sessions, which we discussed in the previous paragraph.
import neptune.new as neptune

run = neptune.init(project = 'Your-Kaggle-Project', run = 'SUN-123')

# Add a new metric
run[“LB_score”] = 0.5

# Download snapshot of model weights
model = run['train/model_weights'].download()

# Continue working
Downloading experiment meta-data
Finally, I know that many Kagglers like to perform complex analyses of their submissions, like estimating the correlation between CV and LB scores or plotting the best score dynamics with respect to time.
While it is not yet feasible to do such things on the website, Neptune allows you to download meta-data from all experiments directly into your notebook using a single API call. It makes it easy to take a deeper dive into the results or export the meta-data table and share it externally with people who use a different tracking tool or don’t rely on any experiment tracking.
import neptune.new as neptune

my_project = neptune.get_project('Your-Workspace/Your-Kaggle-Project')

# Get dashboard with runs contributed by 'sophia'
sophia_df = my_project.fetch_runs_table(owner = 'sophia').to_pandas()
sophia_df.head()
5. Final thoughts
In this post, I shared my story of switching from spreadsheets to Neptune for tracking ML experiments and emphasized some advantages of Neptune. I would like to stress once again that investing time in infrastructure tools - be it experiment tracking, code versioning, or anything else - is always a good decision and will likely pay off with the increased productivity. Tracking experiment meta-data with spreadsheets is much better than not doing any tracking. It will help you to better see your progress, understand what modifications improve your solution, and help make modeling decisions. Doing it with spreadsheets will also cost you some additional time and effort. Tools like Neptune take the experiment tracking to a next level, allowing you to automate the meta-data logging and focus on the modeling decisions.
I hope you find my story useful. Good luck with your future ML projects!
Liked the post? Share it on social media!
You can also buy me a cup of tea to support my work. Thanks!
