
A notebook on machine learning and data science: hands-on tutorials, package overviews, competition write-ups and findings from applied ML projects.
Besides the blog, the site has three larger sections:
- 📁 projects on NLP, computer vision and tabular data
- 📚 research notes on credit scoring, fairness and forecasting
- 🥇 Kaggle notes on competitions and approaches that work
Recent blog posts

- •
- 1
- 2
About this blog
kozodoi.me is a practical notebook on machine learning. Posts start from a concrete problem and end with working code, figures and a short discussion of what to take away. The archive spans PyTorch engineering, tabular data, computer vision, natural language processing and responsible ML.
Most articles began as Jupyter notebooks, so the explanations sit right next to the code that produces every table and chart. Longer code cells are folded by default and can be expanded with a click, which keeps the text readable while leaving the full implementation one step away. Data sets are public or synthetic, and each tutorial can be reproduced on a laptop or in a free cloud notebook.
The intended reader is a data scientist or ML engineer who already knows the basics of Python and wants to solve a specific problem quickly: squeezing a larger batch onto a small GPU, validating a model honestly, or turning a competition idea into something that works in production. Students preparing for their first competitions will find the write-ups useful as worked examples of complete pipelines.
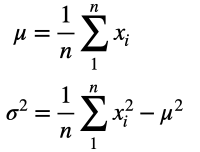
Deep learning engineering. Tutorials show how to accumulate gradients when a batch does not fit into memory, how to set layer-wise learning rates for fine-tuning, how to extract intermediate layer outputs with forward hooks, how to compute channel-wise mean and standard deviation of an image data set, and how to train PyTorch models on TPUs with PyTorch/XLA.
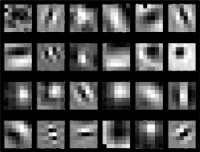
Competitions and applied projects. Write-ups cover detecting diabetic retinopathy on retina photos, pre-training with surrogate labels for skin lesion classification, profit-driven demand forecasting with custom loss functions, and an interactive app for text readability built on transformer models.
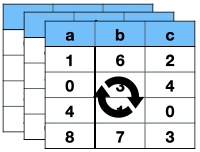
Tabular data and tooling. Other posts explain test-time augmentation for tabular data, tracking ML experiments with Neptune instead of spreadsheets, and measuring algorithmic fairness in R.
Larger case studies live in the portfolio, and background on credit scoring, fairness and forecasting is collected in the research notes.